System Monitor contains widgets that display the system status.
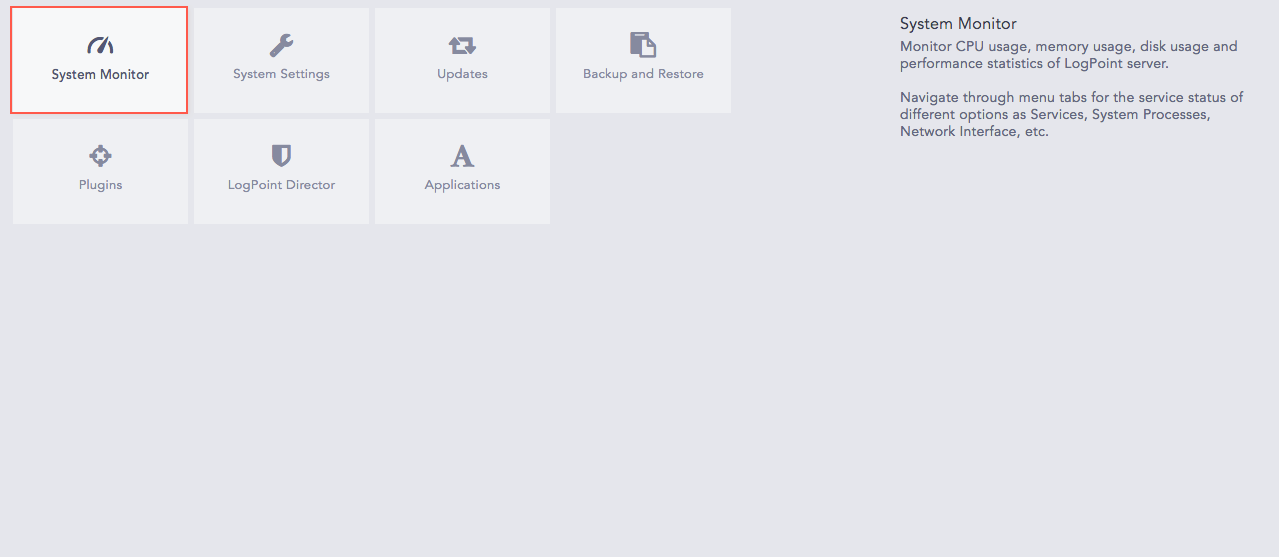
System Monitor Tab
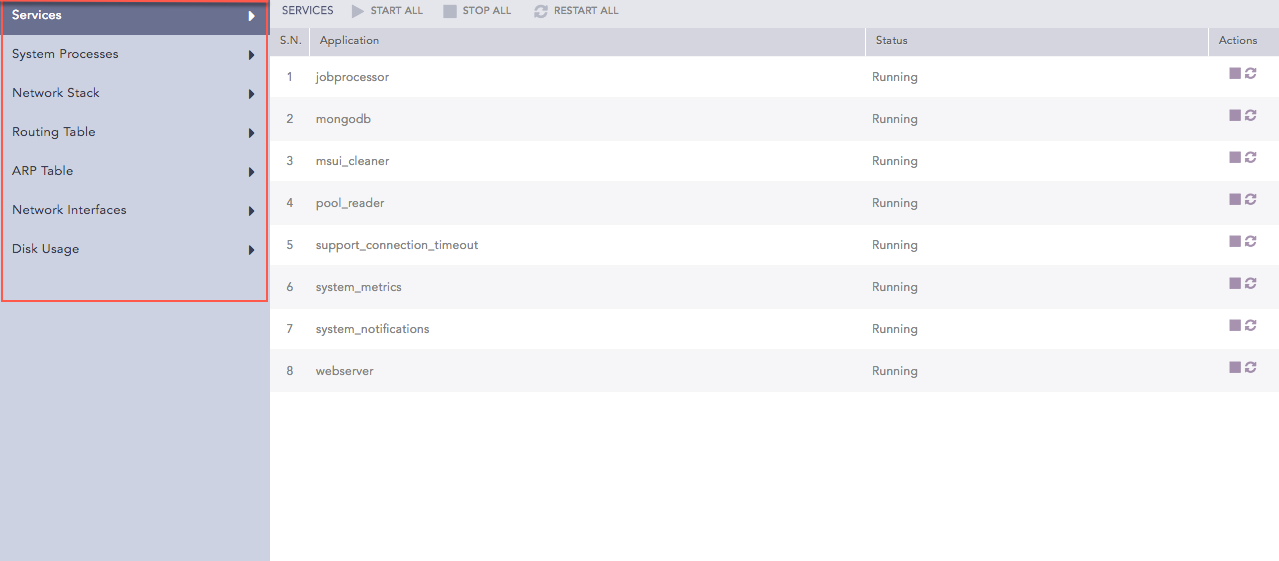
You can view the status of different menu items such as Services, System Processes, Network Stack, Routing Table, ARP Table, Network Interfaces, and Disk Usage.
System Monitor Options
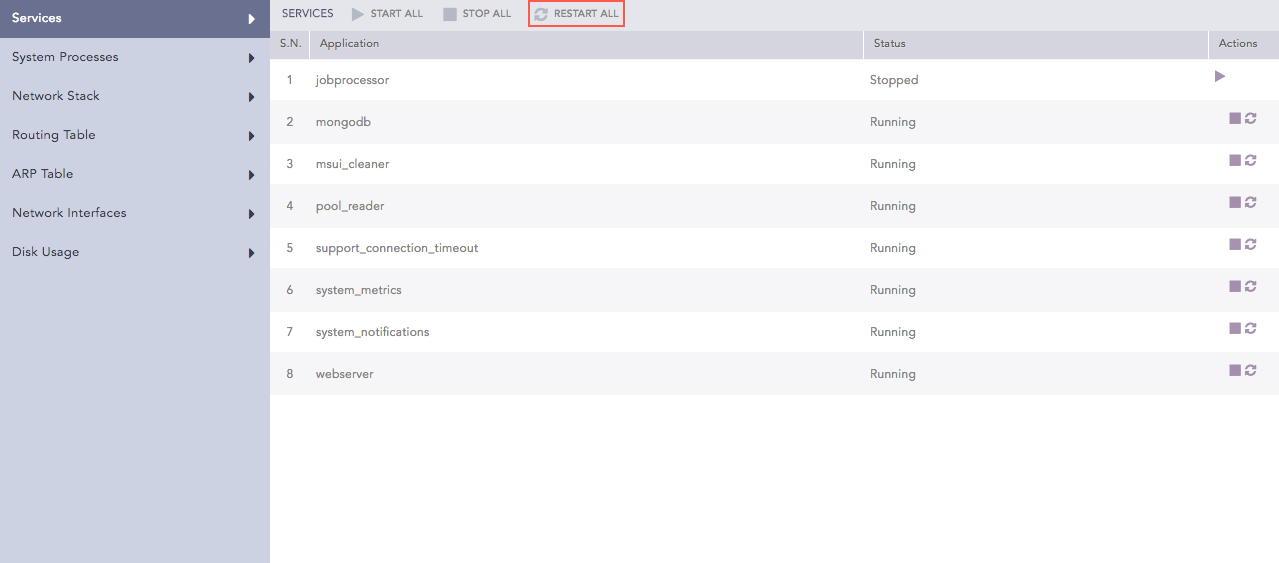
Services lists all the service applications running in LPSM. You can view the status of each application and start, stop, or restart the services.
To initiate an application service, click the Start Service ( ) icon from the Actions column.
To start all services, click Start All.
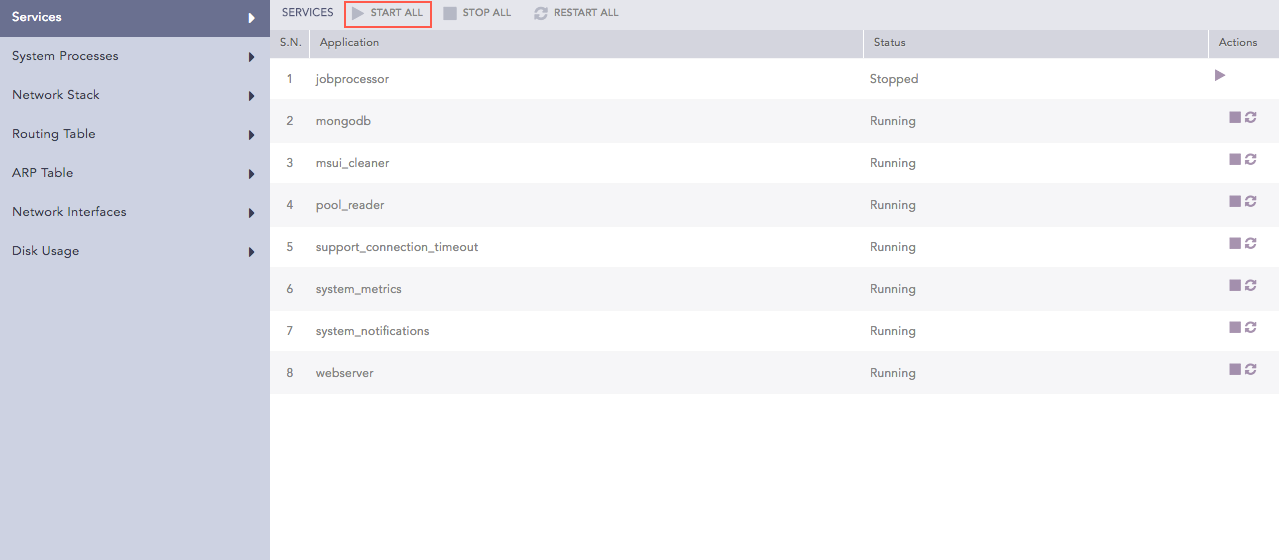
Starting All Services
System Processes shows all the processes running on the operating system where LPSM is installed. The process list shows information such as users, memory used by processes, commands on the run, and process IDs.
Network Stack shows information about the used network protocols and their corresponding network details.
Routing Table displays the routes to particular network destinations.
ARP Table displays a protocol for mapping an Internet Protocol address (IP address) to a physical machine address that is recognized in the local network. The item data lists the connection status for this protocol.
Network Interfaces displays the network status of LPSM. It also displays the status of all the active interfaces such as eth0, l0, he-ipv6, tun0, tun1, and tun10000.
Disk Usage displays the total disk space used by the LPSM file systems. It also displays the available disk, disk usage, and location of the file system.
You can use SNMPv2 or SNMPv3 to monitor the status of the LPSM system components and services using their respective OIDs.
LPSM uses the base OID 1.3.6.1.4.1.54322.4 to get a list of the exposed OIDs and their corresponding information. You can also use the OID of the individual system components and services in LPSM to get their status.
Syntax for snmpwalk via SNMPv2:
snmpwalk -v2c -c <community-string> <LPSM-IP>:161 .OID
Syntax for snmpwalk via SNMPv3:
snmpwalk -v3 -u <user name> -l authPriv -a SHA-256 -A <user password> -x AES -X <AES password> <LPSM-IP>:161 .OID
Note
You must enable SNMP from Settings >> System >> System Settings >> SNMP to monitor the status of LPSM.
The default values of the parameters used in SNMP monitoring are as follows:
Parameter |
Default Value |
|---|---|
<community-string> |
public |
<user name> |
director |
<user password> |
changeme |
AES key |
5nMpvEenC^pt |
OID |
Description |
|---|---|
1.3.6.1.4.1.54322.4.1 |
LPSM Version |
1.3.6.1.4.1.54322.4.2 |
I/O Wait |
1.3.6.1.4.1.54322.4.3 |
VM Swapiness |
|
|
|
|
|
|
Note
The OIDs for the ZFS Pool statistics provide information for the ZFS pools. To retrieve the information for a single pool, add the corresponding value of the respective pool after the ZFS pool base OID.
OID |
Description |
|---|---|
1 |
app_pool |
2 |
app_store_pool |
3 |
data_pool |
4 |
rpool |
For example, you can use 1.3.6.1.4.1.54322.4.4 to retrieve the names of all the ZFS pools and 1.3.6.1.4.1.54322.4.4.1.1 to retrieve the name of the ZFS app pool.
The OIDs for the Service Statistics provide information for LPSM services. To retrieve the information of a LPSM service, add the corresponding value of the respective service after the Service Statistics base OID.
OID |
Description |
|---|---|
1 |
webserver |
2 |
mongodb |
3 |
jobprocessor |
4 |
commander_vpnclient |
5 |
incoherent_updater |
6 |
pool_reader |
7 |
msui_cleaner |
8 |
scheduled_lpsm_backup |
9 |
support_connection_timeout |
10 |
system_metrics |
11 |
system_notifications |
For example, you can use 1.3.6.1.4.1.54322.4.6 to retrieve the names of all the LPSM services and 1.3.6.1.4.1.54322.4.6.1.1 to retrieve the name of the webserver.
 ) icon from the Actions column.
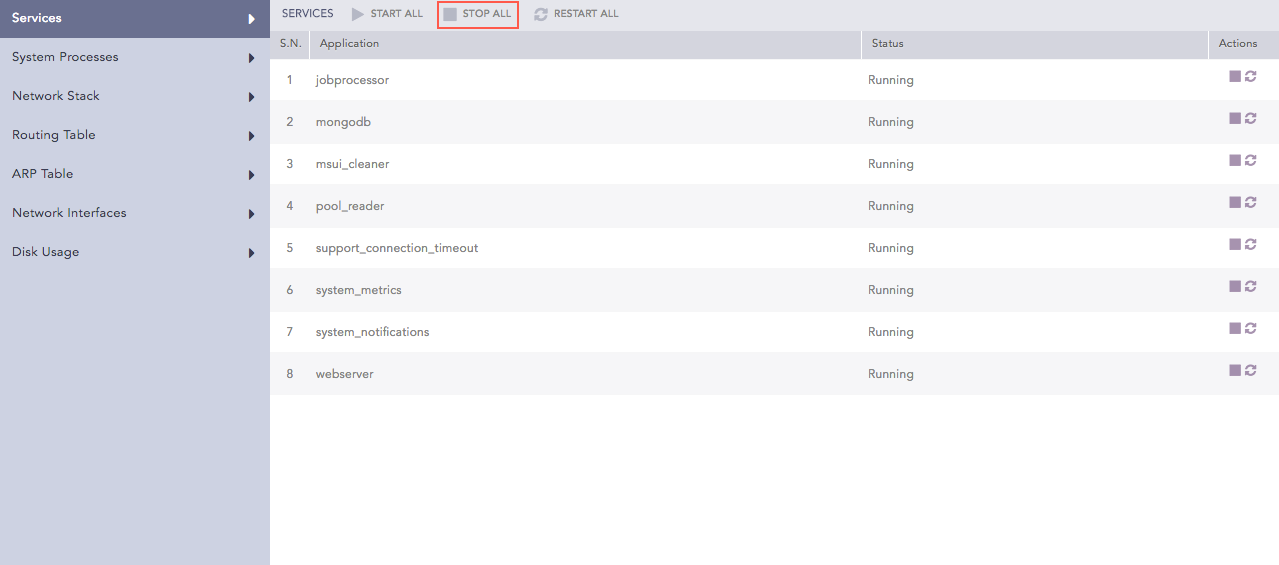
 ) icon from the Actions column.